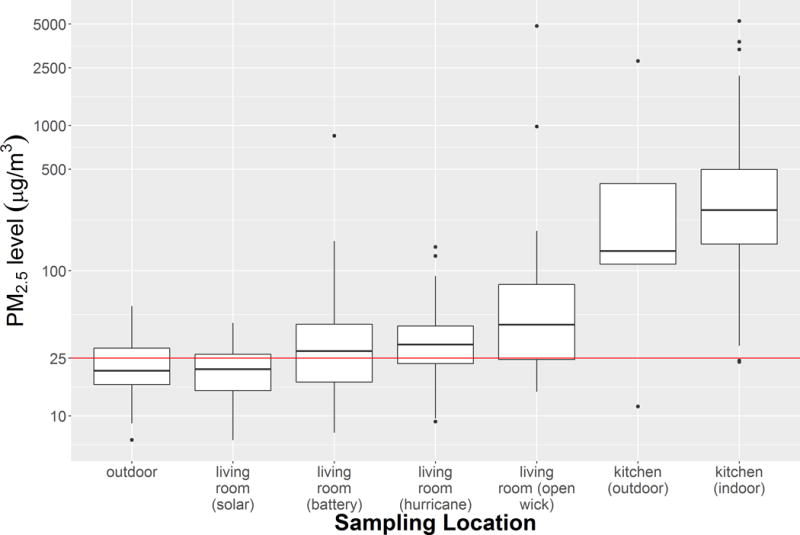
FIGURE 2. Fine particulate matter levels by location.

Boxplots of integrated 24-hour PM2.5 levels by sampling location. Horizontal red line is at PM2.5 concentration of 25 micrograms/m3, the World Health Organization (WHO) guideline level for acceptable indoor 24-hour PM2.5 concentrations.
