
Fig. 3.
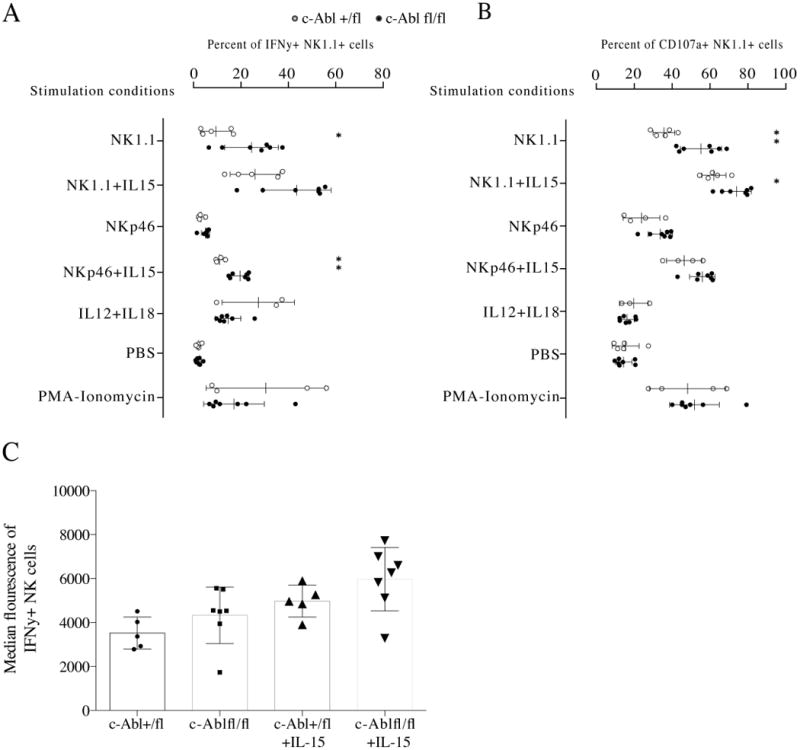
(A) Frequency of IFN-γ+ splenic NK1.1+CD3- cells in c-Abl-deficient mice after stimulation using the agents indicated along the y axis. Each white dot depicts NK cells from a Cre+/- c-Abl +/fl mouse and each black depicts NK cells from a Cre+/- c-Abl fl/fl mouse. Data generated are representative of two independent experiments. (B) Frequency of CD107a+ splenic NK1.1+CD3- cells in c-Abl deficient mice. Data from the same experiments as in A. * p<0,05 and ** p<0,01 using Mann-Whitney test. (C) Median fluorescence intensity of intracellular IFN-γ from the same analysis. The difference between c-Abl-deficient and sufficient NK cells did not reach statistical significance.