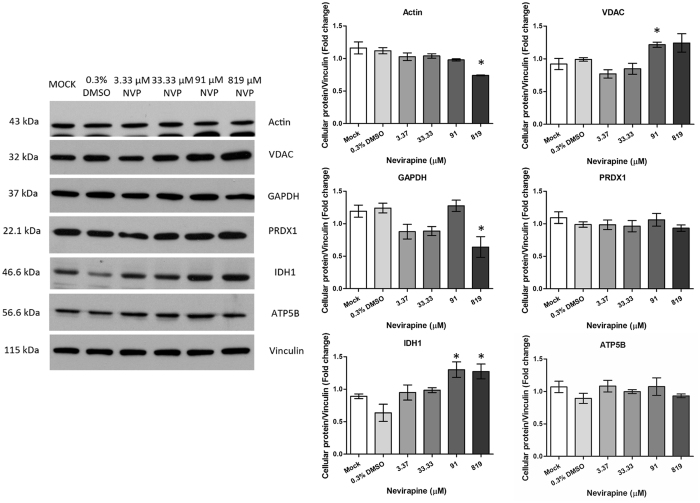
Figure 2.
Western blot analysis of selected proteins. HepG2 cells were not treated (mock), treated with 0.3% DMSO or treated with NVP at concentrations ranging from 3.37 μM to 819 μM. On day 7 of treatment cells lysates were prepared which were subjected to SDS-PAGE and western blot analysis to detect the expression of actin, voltage dependent anion channel (VDAC), Glyceraldehyde-3-phosphate dehydrogenase (GAPDH), peroxiredoxin-1 (PRDX1), Isocitrate dehydrogenase [NADP] cytoplasmic (IDH1), ATP synthase subunit beta, mitochondrial (ATP5B) and vinculin. The experiment was undertaken independently in triplicate. Protein band intensities were quantitated using the imageJ image analysis program and analyzed by GraphPad Prism 5 program and the expression all proteins was normalized to vinculin. Error bars show S.E.M.

