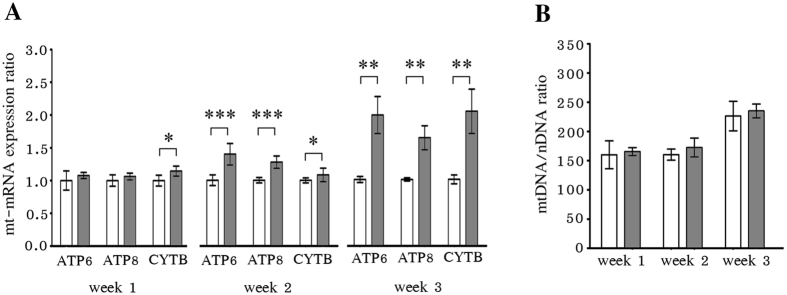
Figure 5.
Low concentration NVP treatment induced changes in mitochondria. HepG2 cells were treated with either 10 μM NVP (gray bars) or 0.0037% DMSO (white bars) for 1, 2 or 3 weeks after which cells were (A) examined for the expression of ATP6, ATP8, CYTB and β-tubulin by RT-qPCR with the expression of the mitochondrial RNA being normalized against β-tubulin and the relative expression level was calculated using 2−∆∆CT method, and (B) the relative mitochondrial genome number was assessed by qPCR with the mitochondrial CYTB gene (mtDNA) being normalized against nuclear FPN1A gene (nDNA). Error bars represent SD (*p value < 0.05, **p value < 0.01 and ***p value < 0.001).

