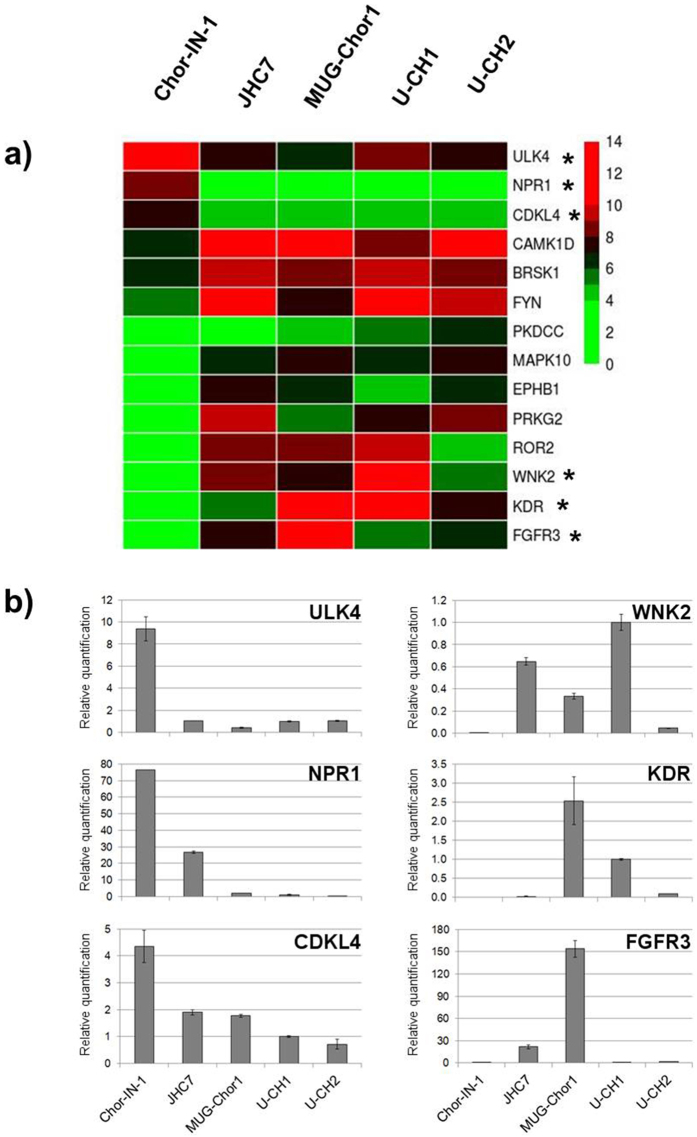
Figure 7.
Identification of kinases differentially expressed in Chor-IN-1 cell line vs. a panel of chordoma cell lines. (a) Heatmap representing the expression levels of the most differentially expressed kinases in Chor-IN-1 cell line, as obtained by NGS analysis using TREx, Illumina, San Diego, CA, USA. Colormap shades reflect relative low to high expression levels, ranging from green (log2 = 0) to red (log2 = 14). (b) RT-qPCR validation of selected genes (indicated with a star in the heatmap). Histogram bars represent RT-qPCR relative quantification results, carried out as described in M&M and normalized using U-CH1 as a reference sample.

