
Figure 1.
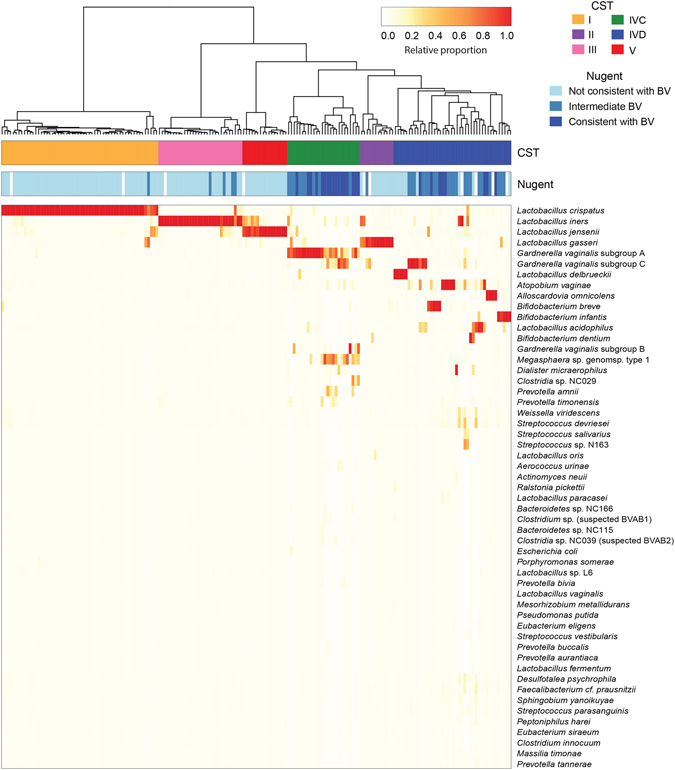
Vaginal microbial profiles of pregnant women at low risk of preterm birth. Heatmap of hierarchical clustering of Jensen-Shannon distance matrices with Ward linkage on the relative proportions of reads for each OTU within individual vaginal samples (n = 182). Each column represents a woman’s vaginal microbiome profile, and each row represents an OTU. Only OTU that are at least 1% abundant in at least one sample are shown. The proportion of the total microbiome comprised is indicated by white to red colour according to the legend. The coloured bars above the heatmap show the community state type (CST) and the Nugent score category (Nugent) for each woman. Legend: white = missing data.