
Figure 4.
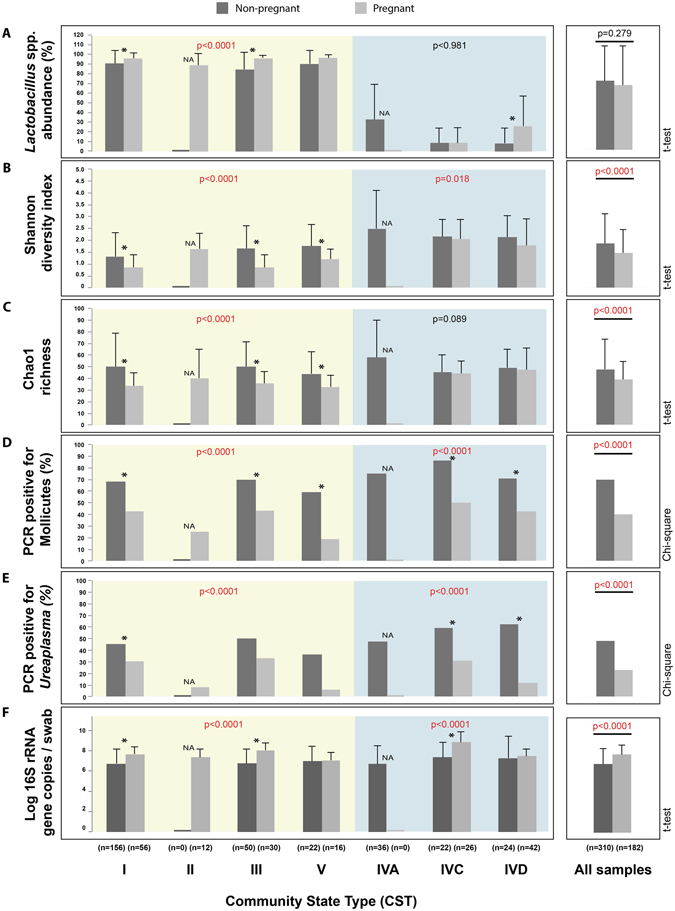
Comparison of the microbial community features between pregnant and non-pregnant participants within each CST. Lactobacillus spp. abundance (A), Shannon diversity (B), Chao1 richness (C), Mollicutes prevalence (D), Ureaplasma prevalence (E) and bacterial load (F) were compared between pregnant and non-pregnant women in each CST. For continuous variables (A–C,F), the mean value is plotted with error bars indicating standard deviation. Significant differences (p < 0.05) between pregnant and non-pregnant women within each CST are indicated by an asterisk. p-values in the main panels refer to the comparison between pregnant and non-pregnant women in Lactobacillus-dominated CST (yellow panel) and non-Lactobacillus-dominated CST (blue panel). A comparison of pooled data from all CST is shown in the right-most panel. Statistical tests used are indicated on the right side of the graph.