
Figure 5.
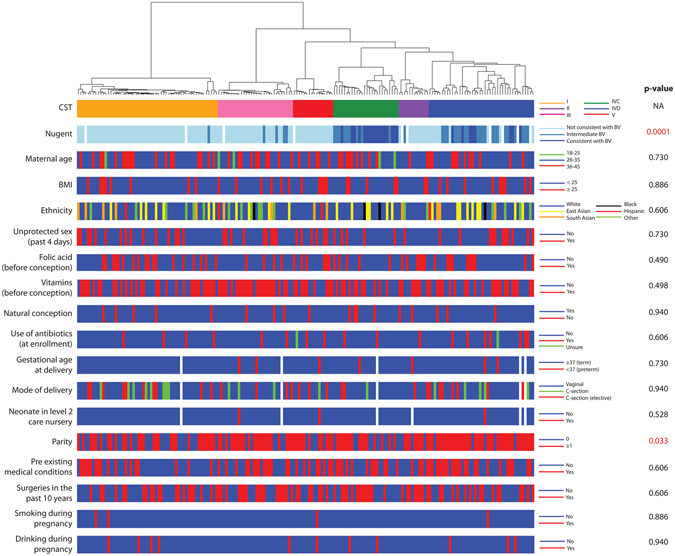
Socio-demographic characteristics of pregnant participants in relation to CST. Hierarchical clustering of microbiome profiles based on Jensen-Shannon distance matrices with Ward linkage of the relative proportions each OTU within individual vaginal samples (n = 182). Demographic characteristics are indicated on the left side, and categories indicated on the right side of each row. Numbers on the right side indicate adjusted p-values of Chi-square test after false discovery rate correction. Fisher’s Exact test was conducted for variables where at least one category had an expected frequency of less than 5. Legend: white = missing data.