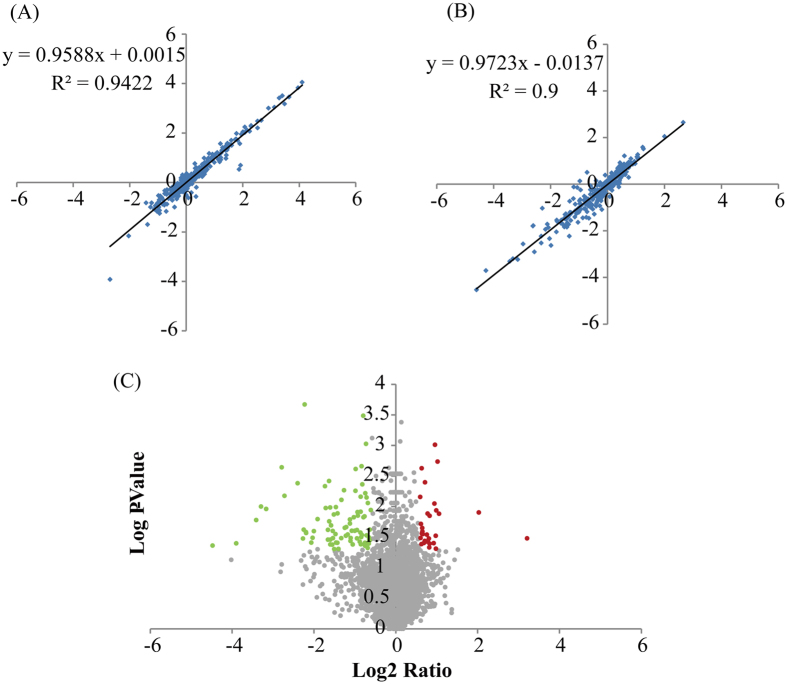
Figure 3.
Comparison of log2 ratios and the volcano plot for the identified proteins from iTRAQ. Log2 values for the ratios of 114:115 in NT (A) and 116:117 ratios in PT (B) were used to show good replication in the iTRAQ experiments. The volcano plot shows the collected p-values (C) for the changes in the patterns of all identified proteins. Red spots represent up-regulated DEPs; gray spots are unchanged proteins; and green spots are down-regulated DEPs.

