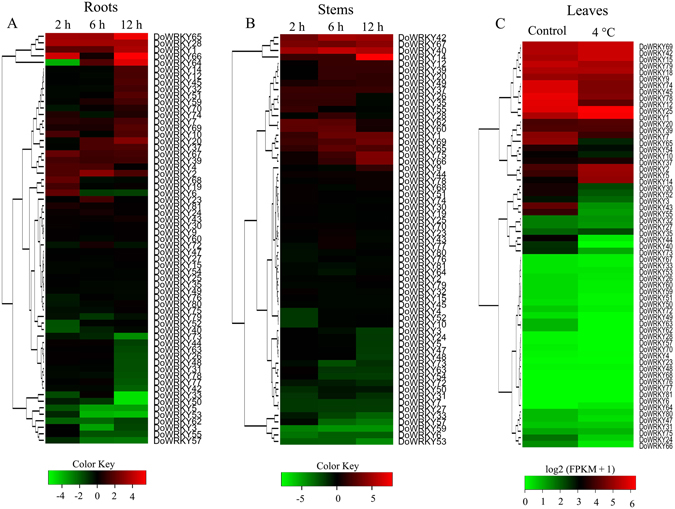
Figure 5.

Expression profiles of DoWRKY genes with an expression pattern in roots, stems and leaves of Dendrobium officinale under cold (4 °C) stress. (A and B) Clustering of DoWRKY genes according to their expression profiles in roots and stems after cold treatments at four time points (0, 2, 6 and 12 h). The expression of the 63 DoWRKY genes was assessed based on an analysis of qPCR results. (C) Heat map showing expression pattern of DoWRKY genes in leaves under cold stress for 20 h. The Y-axis represents the value of the relative expression level [log 2 (mean of FPKM + 1)].
