
Figure 2.
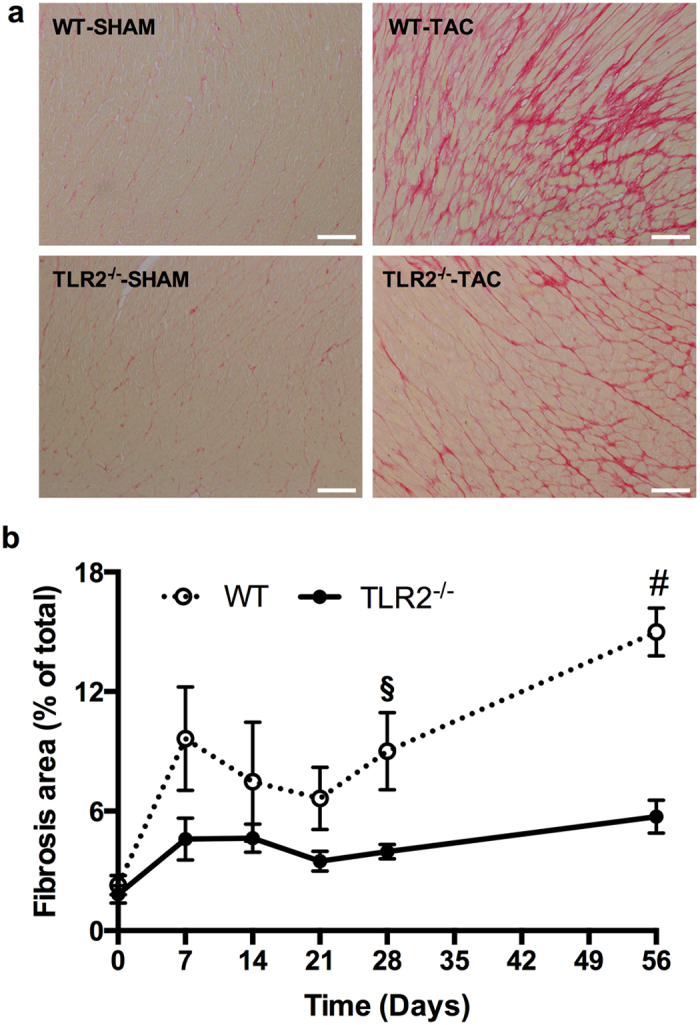
Interstitial fibrosis in the heart. (a) Representative images of heart sections stained with Picrosirius Red to show collagen deposition. Scale bars = 100 μm. (b) Quantification of Picrosirius Red stained area (fibrosis area) as % of the whole LV area at indicated timepoints after TAC. The numbers of mouse hearts extracted at each timepoint for each genotype of mice were the same as described in Figure 1. §p < 0.01, #p < 0.001.