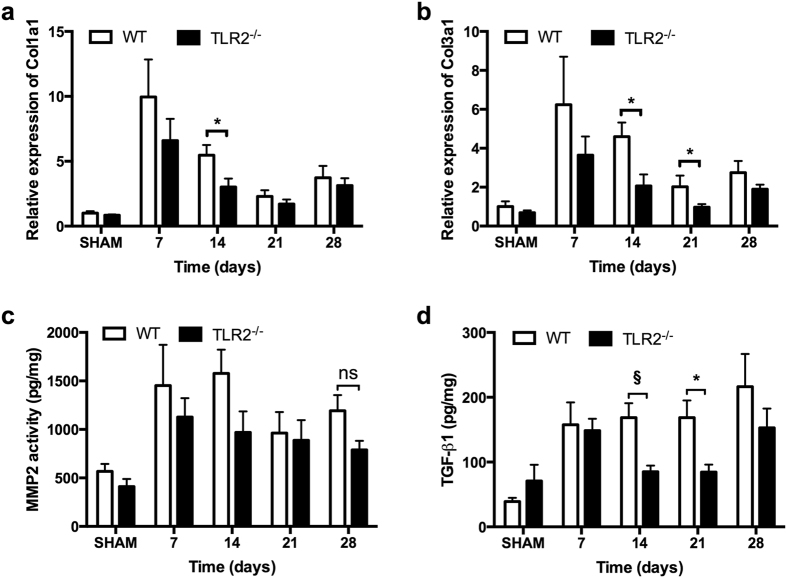
Figure 3.
Collagen synthesis and breakdown in the heart. (a,b) Relative expression of Col1a1 and Col3a1 in the heart were quantified by qRT-PCR and normalized to WT-SHAM. GAPDH was used as an internal control. (c) Activity of MMP2 in heart tissue was determined at indicated timepoints. (d) Protein level of TGF-β1 in heart tissue was determined by multiplex assay at indicated timepoints. Bars represent mean ± SEM. Mouse hearts were extracted at indicated timepoints, n = 6–8 mice per genotype per timepoint. Mann Whitney U test was performed to determine the difference between groups at individual timepoints; *p < 0.05, § p < 0.01, ns indicating not significant.

