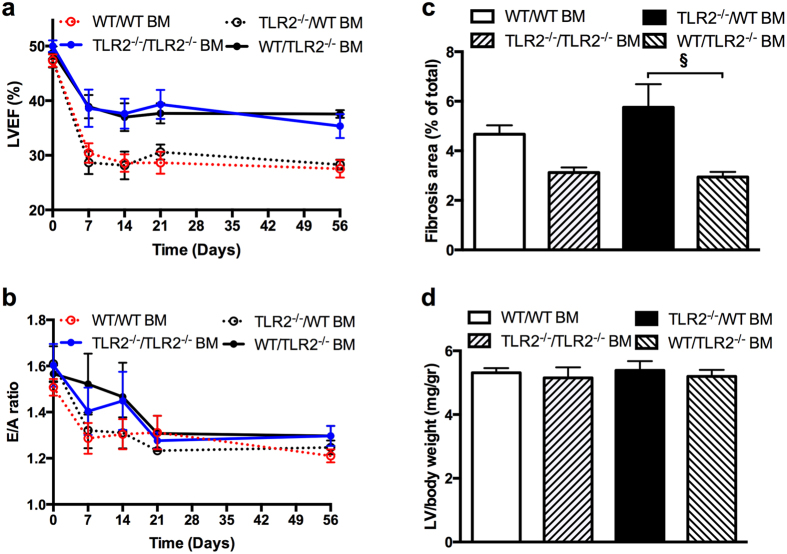
Figure 5.
Cardiac function, fibrosis and hypertrophy after TAC in bone marrow chimaeric mice. (a) LVEF measured by echocardiography at 0 day (baseline), 7 days, 14 days, 21 days, and 56 days after TAC in 4 types of BM chimaeric mice consisting of WT mice with TLR2−/− BM (WT/TLR2−/− BM), TLR2−/− mice with WT BM (TLR2−/−/WT BM), WT with WT BM (WT/WT BM) and TLR2 with TLR2 BM (TLR2−/−/TLR2−/− BM) showing a large difference between the 4 types of BM transplantation (p < 0.001). (b) E/A ratio measured by echocardiography at 0 day, 7 days, 14 days, 21 days, and 56 days after TAC in the 4 types of BM chimaeric mice. (c) Fibrotic area as % of LV area at 8 weeks after TAC using Picrosirius Red staining in the 4 types of BM chimaeric mice. Fibrotic area was different between the 4 types of BM transplantation analyzed with Kruskal-Wallis test (p = 0.001). Difference in fibrotic area between WT/TLR2−/− BM and TLR2−/−/WT BM was determined with Mann-Whitney U test; § p < 0.01. (d) Hypertrophy as measured by wet LV weight corrected for body weight in mg/g at 8 weeks after TAC in the 4 types of BM chimaeric mice. N = 6–10 per type of BM chimaeric mice.

