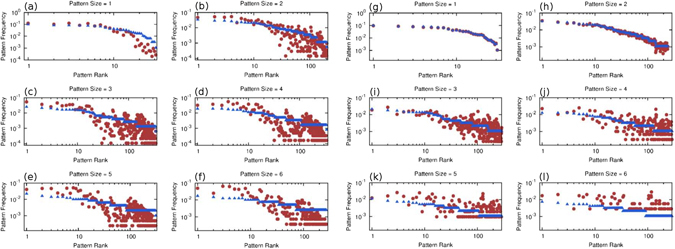
Figure 4.

Frequency-rank plots for pattern frequencies. In blue, all patterns appearing in the corpus of sizes 1 to 6 are ranked according to their frequency. Here the corpus is the Bach Partita used previously (see Section S3 of the SI). Then, the same patterns are located in a N = 15000 sequence generated from the Maximum Entropy model (a–f) and a first-order Markov model (g–l). In red we plot their frequencies in the generated sequence but using the same order as before in order to compare with the corresponding frequencies in the corpus. For the Markov model, note that there is a good agreement for small patterns and worse for large ones. Note also that for the larger patterns (especially for size = 6) much fewer corpus patterns were found in the generated sequence, i.e. there are fewer red points than in the corresponding Maximum Entropy panel.
