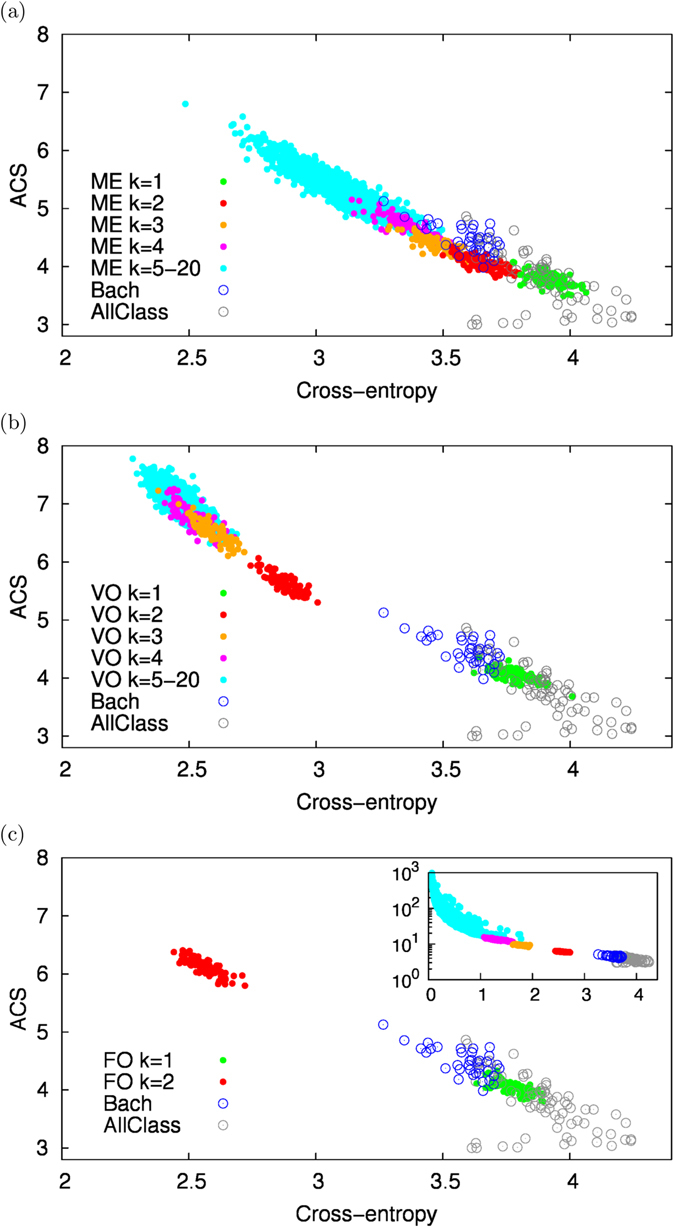
Figure 5.

Borrowing vs. similarity. This figure reports the Average Common Substring (ACS) vs. the values of the cross-entropies for all the artificial sequences generated with the Maximum Entropy (ME) model (a), the variable-order (VO) Markov model (b) and the fixed-order (FO) Markov model (c). Everything is computed with respect to the sequence of J.S. Bach’s first violin Partita (see Section S3 of the SI). Filled circles correspond to the artificial sequences. Colors code for the values of K max in each different model. In addition in each panel the empty circles reports the same quantities for other original sequences of Bach (represented with blue circles) and other classical authors - Beethoven, Schumann, Chopin, Liszt and Albeniz - (AllClass represented with grey circles). Note that the main panel for FO is truncated at values of ACS equal to 8, while the complete plot is shown in the inset.
