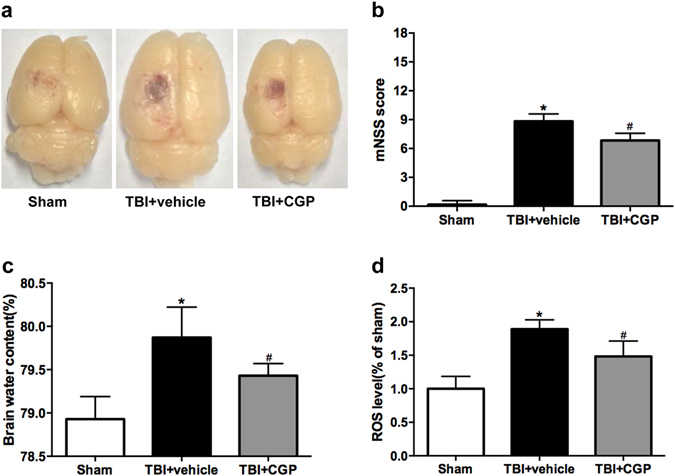
Figure 1.

The representative pictures of the TBI model in different groups, the modiefied neurological severity scores (mNSS), the brain water content and ROS levels at 24 hours after TBI. (a) Typical brains from Sham, TBI+ vehicle, and TBI+ CGP group. (b) Quantification of the mNSS. (c) Quantification of the brain water content. (d) Quantification of ROS levels. Data are represented as the mean ± SD, n = 6 rats per group. * P < 0.05 vs sham, # P < 0.05 vs TBI+ vehicle.
