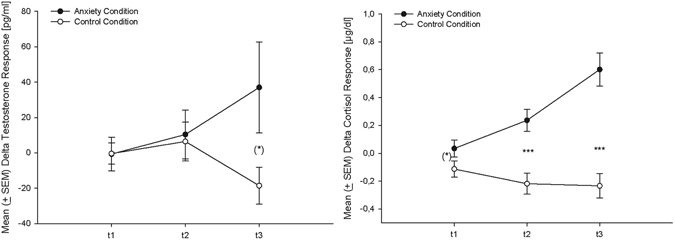
Figure 1.

Testosterone (left, n = 17) and cortisol (right, n = 18) change-scores (in reference to baseline: Mean ± SEM) at the three time points (t1 = 30 minutes prior to the oral examination/ following the first bicycling set, t2 = immediately before the oral examination/ following the third bicycling set, t3 = immediately after the oral examination/ by the end of the ergometer session, time points separated by 30 min each), (*)p < 0.10, ***p < 0.001 (according to t-tests).
