Figure 2.
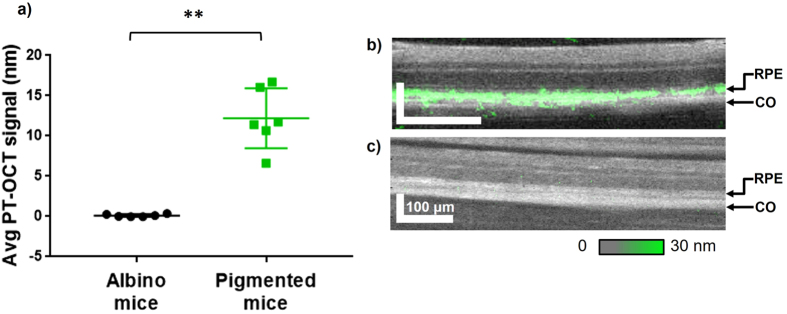
In vivo PT-OCT of melanin. (a) Average PT-OCT signal from the retina for albino mice (no melanin) and pigmented mice (melanin) cohorts (n = 6 eyes per group). Photothermal laser power at 8 mW. Mean with standard deviation shown. **p < 0.01. (b) Example OCT B-scan of a pigmented mouse retina (grayscale) with PT-OCT signal overlaid (green). (c) Example OCT B-scan of an albino mouse retina (grayscale) with PT-OCT signal overlaid (green, no signal visible). The OCT images show fewer retinal layers than in a typical OCT B-scan of a human retina because of the smaller dimensions of a mouse retina and the axial resolution of standard 860 nm OCT systems, which are also used for human retina imaging. The PT-OCT signal represents the change in optical path length, in units of nm. Scale bar: 100 μm. RPE: retinal pigment epithelium. CO: choroid.

