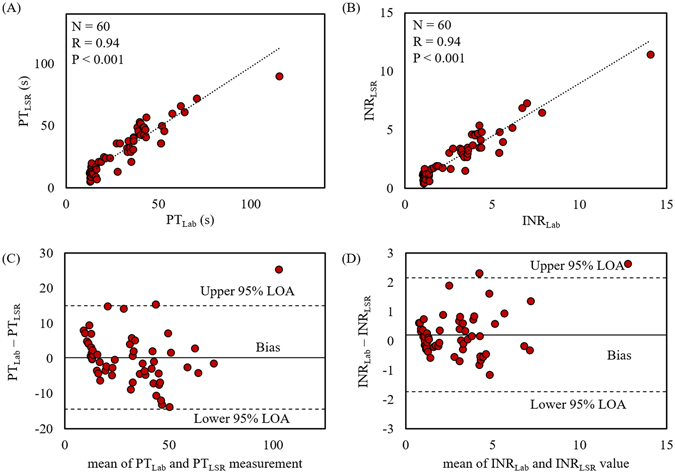
Figure 3.

The plots show (A) PT and (B) INR measured using the LSR sensor against corresponding values obtained from standard laboratory tests measured from 60 patient whole blood samples. A strong statistically significant correlation between the two approaches (R = 0.94, p < 0.001) is observed. Bland-Altman plots comparing (C) PT and (D) INR measured with the LSR sensor and standard laboratory results show high concordance between both test measurements. Upper and lower dotted lines represent 95% limit of agreement (LOA) while the middle line represents bias that shows the average difference in the values measured with LSR sensor and laboratory test.
