Figure 1.
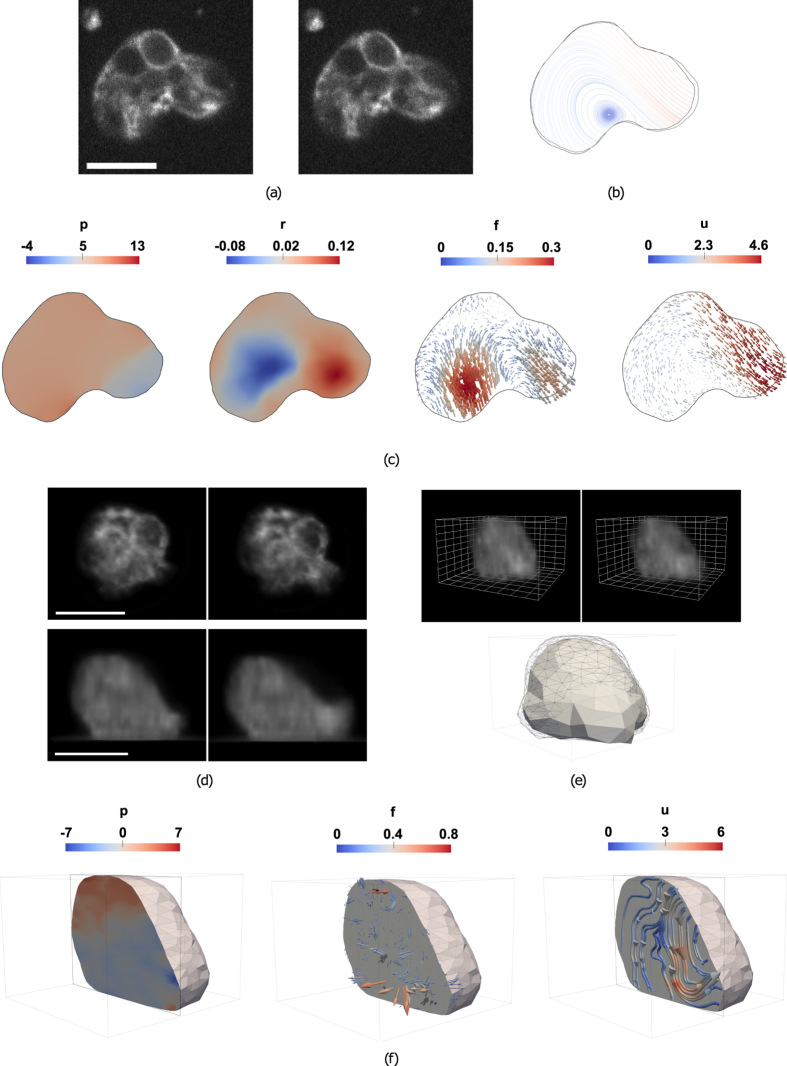
Overview of BioFlow. (a–c) BioFlow in 2D. (a) Two consecutive frames of a 2D time-lapse microscopy sequence (see Supplementary Movie M1 for the full movie); scale bar: 10 μm. (b) Cell contours extracted from the first (black) and second (grey) frames, and streamlines of the extracted velocity field (integrated using a Runge-Kutta 4–5 algorithm). (c) From left to right, estimated 2D intracellular pressure p (Pa), out-of-plane flow r (s −1), forces f (nN/μm 2) and velocity u (μm/s). (d–f) BioFlow in 3D. (d) Axio-lateral slices of two consecutive frames of a 3D time-lapse microscopy sequence. (e) Top row: 3D volume rendering of (d); grid spacing 2 μm); Bottom row: Cell contours extracted from the first (black wireframe) and second (solid mesh) frames. (f) From left to right, sliced view of the estimated 3D intracellular pressure, forces and velocity (the velocity field is displayed as streamlines for better visualisation).

