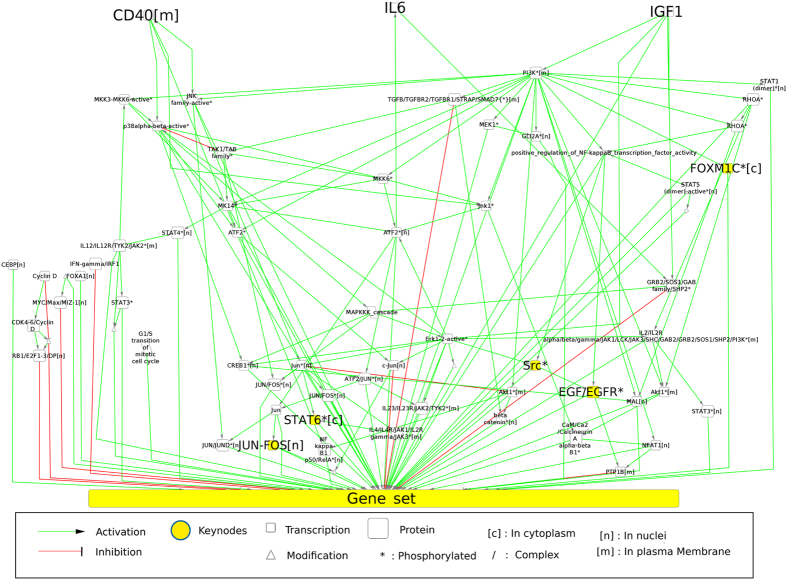
Figure 2.
Representation of the subgraph obtained from the PID-NCI database. CD40, IL6 and IGF1 (the nodes in the top portion of the graph) are the 3 queried pathways. The 529 genes that are differentially expressed across all profiles are merged for this representation in the node “Gene set”. The 5 top-ranked nodes according to their FS are labeled in bold type and colored in yellow. We used the same syntax for all nodes in this study. The edges from the “Gene set” node to proteins have been deleted for the sake of clarity.

