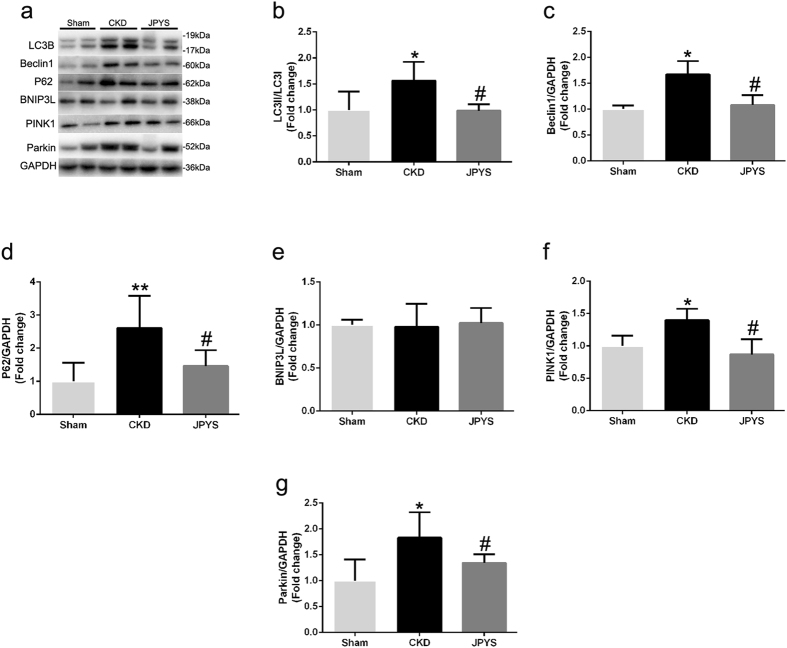
Figure 6.
Effect of JPYS decoction on skeletal muscle autophagy/mitophagy pathway in 5/6 nephrectomised rats. (a) Representative Western blot images of LC3B, Beclin1, P62, BNIP3L, PINK1 and Parkin protein expression. Quantification of (b) LC3II/LC3I ration, (c) Beclin1, (d) P62, (e) BNIP3L, (f) PINK1 and (g) Parkin protein levels. GAPDH was used as loading control. Data are expressed as Fold change vs. Sham and reported as means ± SD, n = 6 per group, *P < 0.05, **P < 0.05 between Sham and CKD groups. #P < 0.05 between CKD and JPYS groups.

