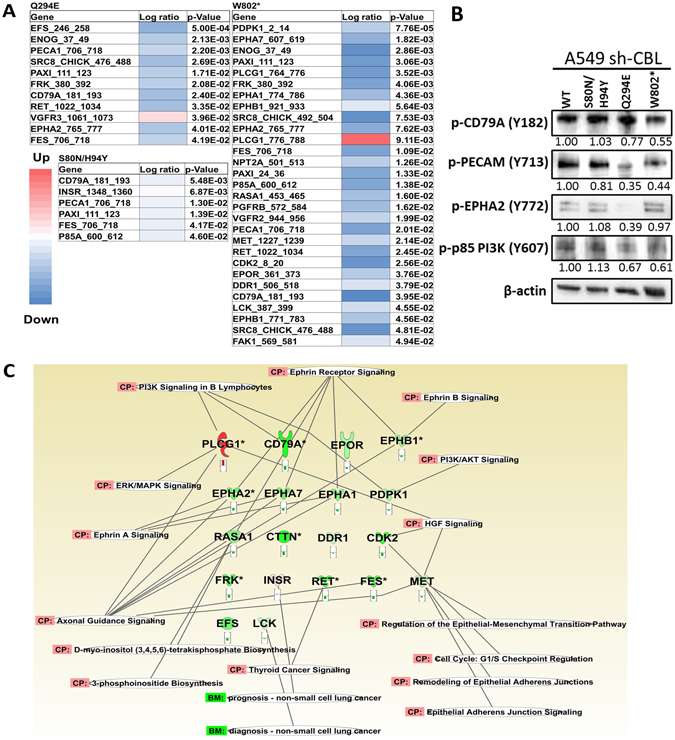
Figure 5.

The Heatmap of CBL mutations. (A) PamGene analysis was performed to detect the RTK phosphorylation difference between CBL WT and mutants. A549 CBL isogenic cells were treated with MET inhibitor SU11274. After treatment with SU11274, and in comparison with CBL WT, significantly changed peptides were shown as a heatmap. Red color represents the signal upregulation and the blue color represents the signal downregulation. (B) The protein expression of common targets in three CBL mutations was validated by immunoblotting. Protein expression was quantified and indicated with the fold change numbers shown below each immunoblot in comparison with WT. Each protein lysates of separated blot of were collected in the same time period for and the lysates were loaded in one gel per antibody staining. (C) Significantly different peptides were used to analyze affected signaling pathways by Ingenuity Pathway Analysis (IPA). PI3K/AKT, ephrin A, ERK/MAPK, and other signaling pathway were involved especially MET/HGF signaling pathway.
