Figure 7.

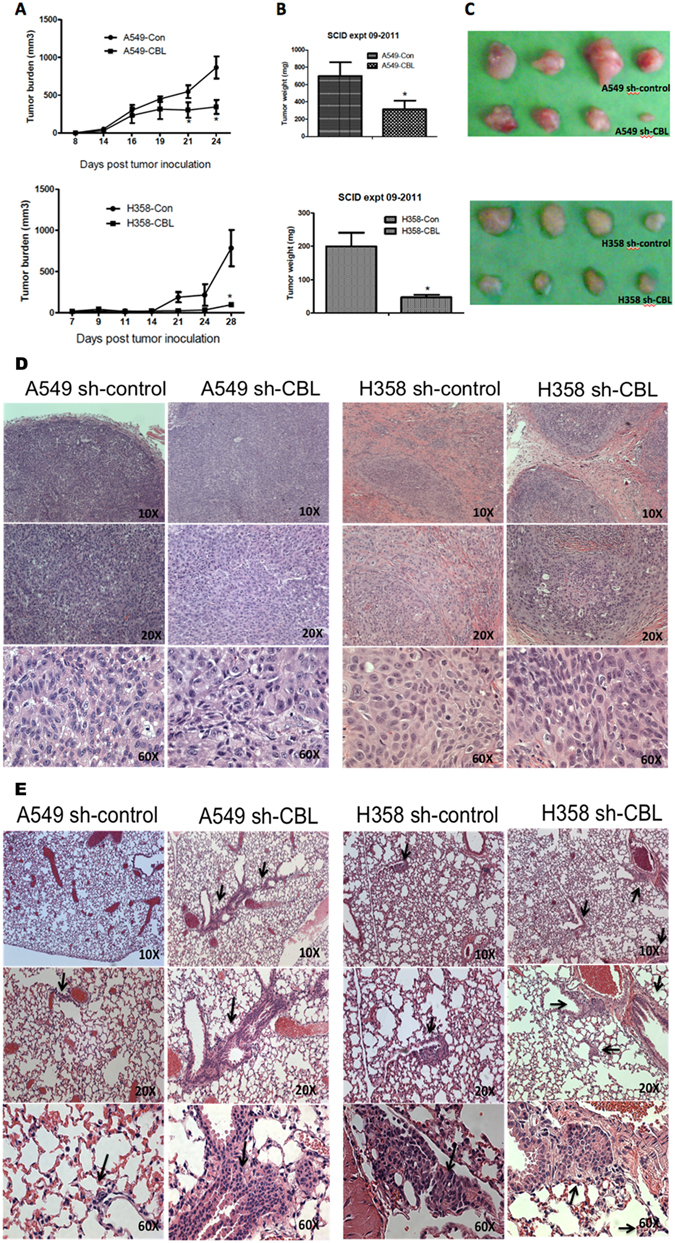
Tumor growth of CBL knockdown cells in mouse xenograft model. (A) Tumor was assessed three times a week. sh-control (con) of A549 and H358 cells showed more rapid growth of tumor than sh-CBL (CBL) cells. (B) Tumor weight of sh-CBL groups in A549 and H358 cells showed a significant difference compared with sh-control (* p < 0.05). (C) Photograph of tumors from 4 mice of sh-control and sh-CBL groups in A549 and H358 cells. (D) H&E staining of primary tumors from sh-control and sh-CBL groups in A549 and H358 cells at 10x, 20x, and 60x magnifications. (E) Metastasis study of CBL knockdown cells in vivo. H&E staining of lung tumors showed more tumor metastasis results by pathologist’s reading from the subcutaneous injection site to the lung in both A549 and H358 sh-CBL cells than in sh-control cells. Metastatic tumors shown by black arrows.
