Figure 2.
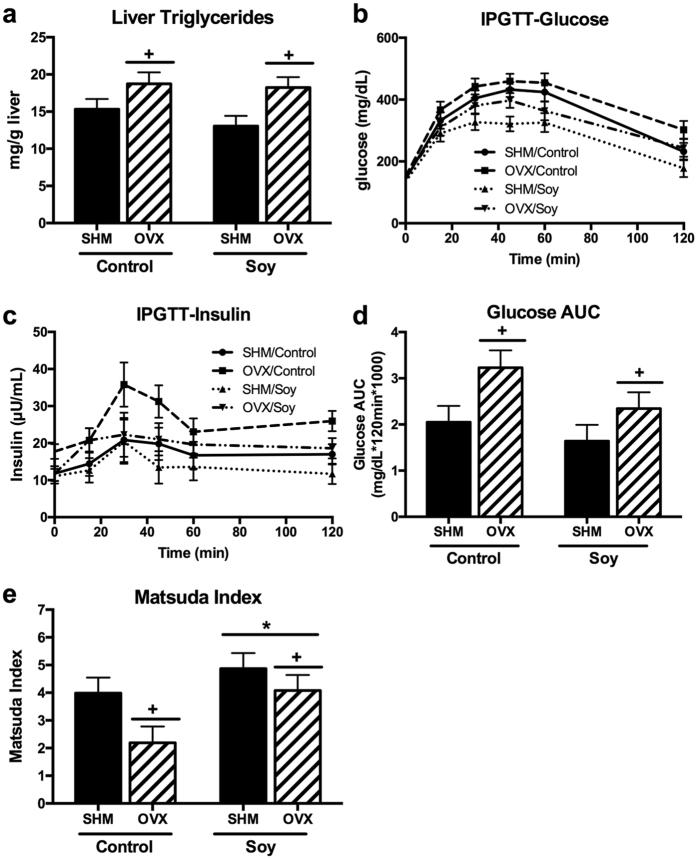
OVX led to greater concentrations of liver triglycerides (a). Intraperitoneal glucose tolerance test was performed at 19wk post-surgery and glucose (b) and insulin (c) changes over time was plotted. Corresponding glucose area under the curve (AUC) (d) and Matsuda Index (e) was calculated from ovariectomized (OVX) vs. sham-operated (SHM) rats bred for low-running capacity fed either a soy-rich or soy-free diet. Data were analyzed using the Mixed Models procedure of SAS 9.3 with diet and surgery being fixed effects and animal ID being a random effect. When a main effect was significant, post hoc pairwise comparisons were performed using Tukey’s multiple comparison tests. Data are least-squares means ± SEM, n = 4–10. +Denotes main surgery effect (OVX vs. SHM); *Denotes main diet effect (Control vs. Soy), P < 0.05.

