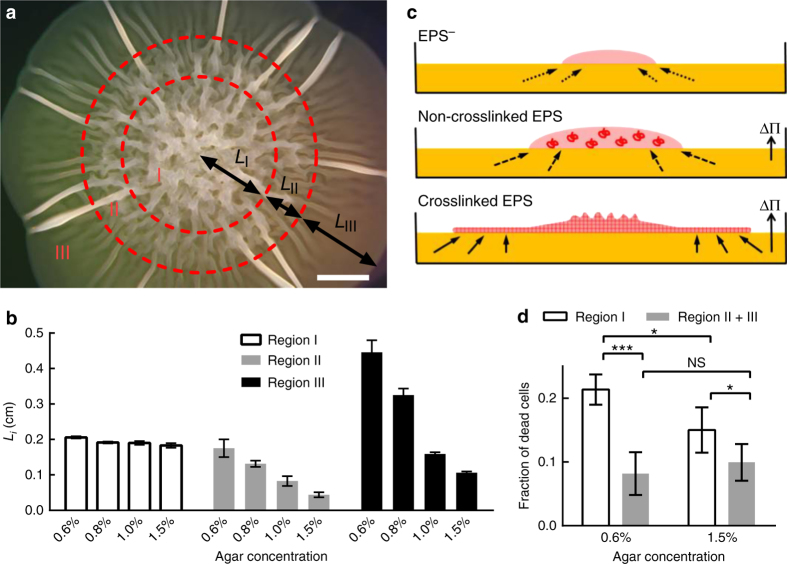
Fig. 2.
V. cholerae colony biofilms display distinct spatially patterned regions that depend on osmotic pressure. a Representative 2-day-old Rg_M colony grown on LB medium containing 0.6% agar imaged by stereomicroscopy. Three regions can be identified (denoted I, II, and III). L i denotes the length scale of each reproducibly identifiable region. Scale bar: 0.2 cm. b Quantitation of L i as a function of agar concentration. c Schematic representation of the proposed colony expansion mechanism for the EPS− (top) strain, a strain containing non-crosslinked EPS (middle), and a strain containing crosslinked EPS (bottom). Pink denotes the bacterial colony (and matrix if present). Yellow denotes the solid surface, which contains nutrients. The red coils (middle) denote non-crosslinked matrix polymers. ΔΠ denotes the osmotic pressure difference across the interface between the colony and the solid surface. The red mesh (bottom) depicts crosslinked matrix that forms a hydrogel network. Arrows with dotted lines denote nutrient uptake by diffusion (top); solid arrows denote nutrient transport due to the osmotic pressure difference (bottom), and arrows with dashed lines denote the intermediate case (middle). d Region I is the nutrient-limited zone in which higher cell death occurs compared to regions II and III. Paired t-tests were performed in d within the groups and unpaired t-tests with Welch’s correction were performed between the groups. NS denotes not significant; *denotes P < 0.05, and ***denotes P < 0.001. All error bars correspond to standard deviations with n = 4

