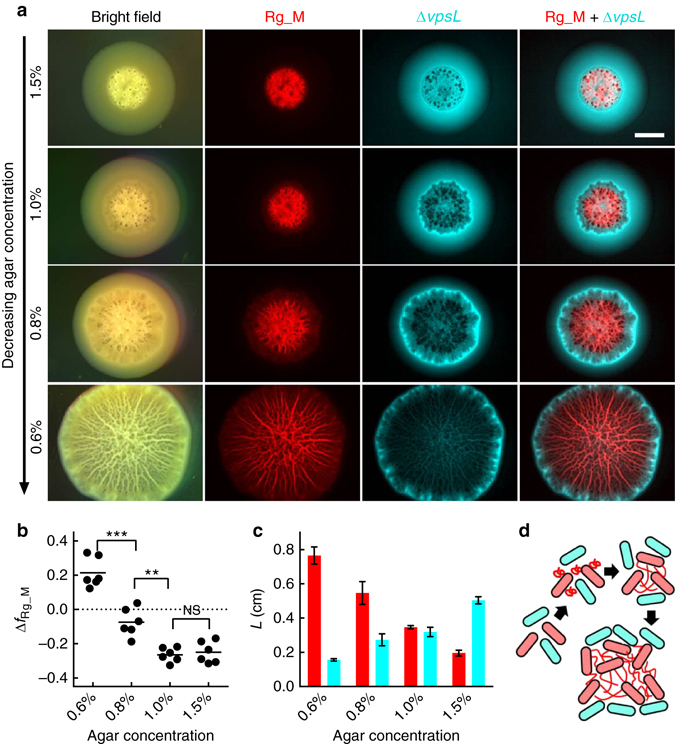
Fig. 4.

Osmotic pressure confers a growth advantage to the V. cholerae matrix producer over the non-producer via physical exclusion. a Images of 2-day-old colony biofilms formed on LB medium with decreasing agar concentration (top to bottom) formed from an initial inoculum containing a 1:1 mixture of the Rg_M strain (red) and the ΔvpsL strain (cyan), obtained using stereomicroscopy in bright field mode (left-most column), a red filter (second column), a cyan filter (third column), and overlaid images from the red and cyan channels (right-most column). Scale bar: 0.3 cm. b Change in frequency of the Rg_M strain (Δf Rg_M) during a 2-day competition with the ΔvpsL strain on agar plates containing the designated concentrations of agar. The initial Rg_M frequency was ~0.5. c Quantitation of the sizes of the region L spanned by the Rg_M strain (red) and by the ΔvpsL strain (cyan) as a function of agar concentration. For the Rg_M strain, L corresponds to the radius to which the Rg_M strain extended. For the ΔvpsL strain, L corresponds to the width of the annulus in which the ΔvpsL strain is present as in a. Unpaired t-tests with Welch’s correction were performed for statistical analyses. NS denotes not significant; **denotes P < 0.01 and ***denotes P < 0.001. Error bars correspond to standard deviations with n = 6. d Schematic representation of the proposed physical exclusion process. Red and cyan cells denote the matrix producer and non-producer, respectively. Red wavy lines depict matrix polymers
