Figure 2.

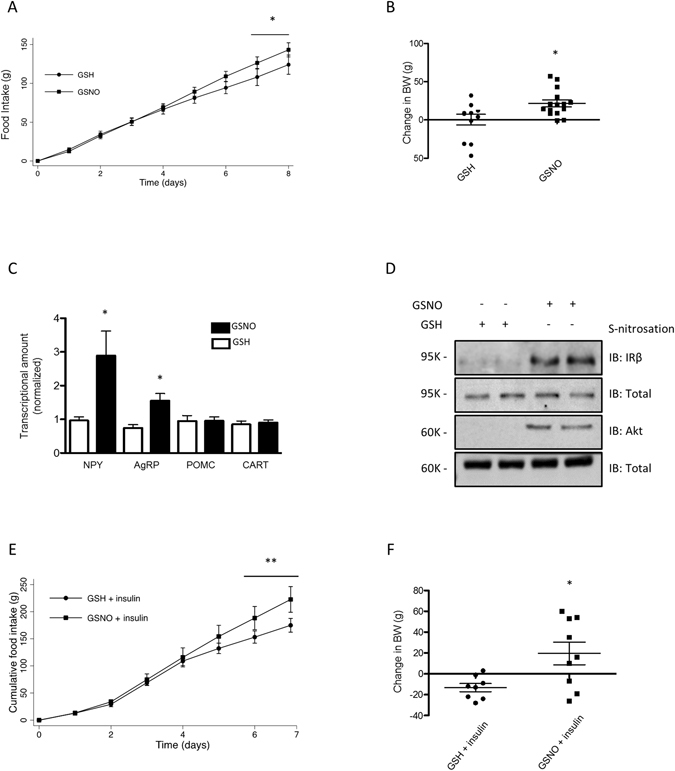
GSNO induces insulin resistance in hypothalamus. Cumulative food intake (A) and body weight change (B) of GSH or GSNO treated rats. Real-time analysis of NPY, AgRP, POMC and CART, expression generated from GSH or GSNO treated rats (C). Biotin switch method analysis for IRβ and Akt S-nitrosation in rats treated with GSNO (D). Cumulative food intake (E) and body weight change (F) in insulin or insulin plus GSNO treated rats. Data are presented as mean ± SEM, *p < 0.05 vs. GSH -injected rats; **p < 0.01 vs. GSNO treated group (n = 10–15 animals per group).
