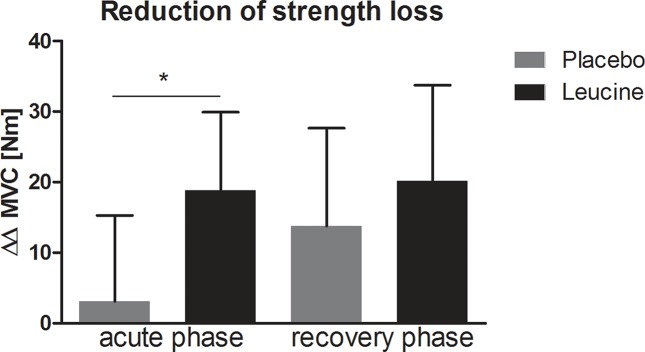
Figure 4.
Reduction of strength loss after intervention described as averaged differences (visit 4 compared with visit 1) of the baseline corrected time points 0hours and 24–48 hours. This depicts the extent of strength reduction due to intervention for the acute phase after the stress test and the extent of strength reduction for the recovery phase after the stress test (mean+95% CI). MVC, maximal voluntary contraction. *p<0.05.

