Figure 5.

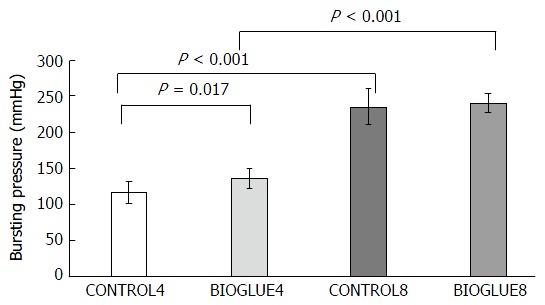
Comparative bar chart presenting bursting pressures (mmHg) (mean ± SD). A statistically significant increase in the bursting pressure was noted on the fourth postoperative day in the Bioglue subgroup compared to the control.

Comparative bar chart presenting bursting pressures (mmHg) (mean ± SD). A statistically significant increase in the bursting pressure was noted on the fourth postoperative day in the Bioglue subgroup compared to the control.