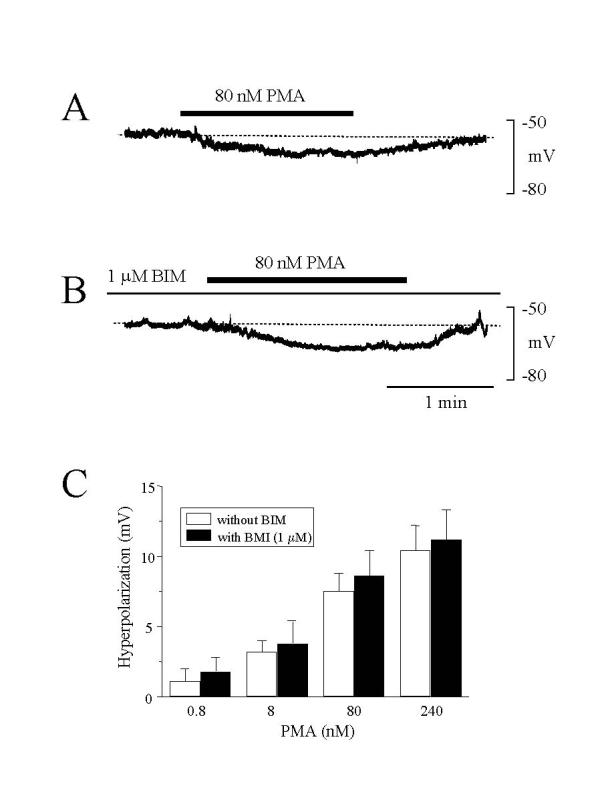
Figure 2.

PMA induced membrane hyperpolarization. (A) PMA (80 nM) applied during a steady-state phase of membrane potential in a solution containing 5.5 mM glucose caused a slow hyperpolarization. (B) In cells treated with BIM (1 μM), PMA (80 nM) induced a similar slow hyperpolarization. Representative traces in A and B from at least six experiments are shown. (C) Concentration-response relationships of PMA-induced hyperpolarization in cells treated and untreated with BIM. Results are from 5–8 experiments. The vertical bars represent SEM. The values with PMA at the same concentration are not significantly different in cells treated or untreated with BIM.
