Figure 4.

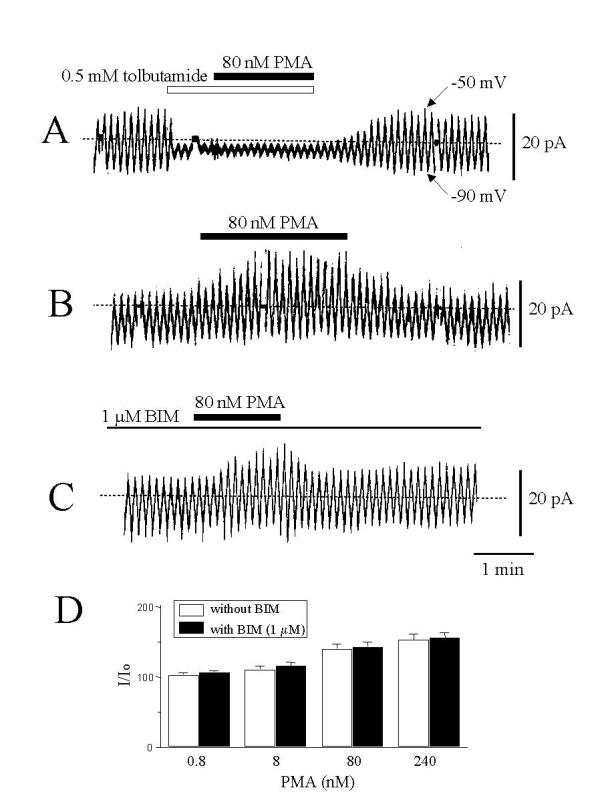
The effect of PMA on membrane current in response to voltage ramp pulses. Whole cell membrane currents in response to voltage ramps from -90 to -50 mV, recorded while clamping the ATP concentration at 1 mM in the pipette solution, are shown. (A) The effect of tolbutamide (0.5 mM), and the effect of PMA (80 nM), applied on top of tolbutamide exposure. (B) The effect of PMA (80 nM) alone. (C) The effect of PMA on cells treated with BIM (1 μM). (D) Concentration-response relationships for the PMA effect on currents in cells treated or untreated with BIM (1 μM). The size of membrane current was expressed relative to that before application of PMA. The values with PMA at the same concentration are not significantly different for cells treated with or without BIM. Results are from 5–7 experiments.
