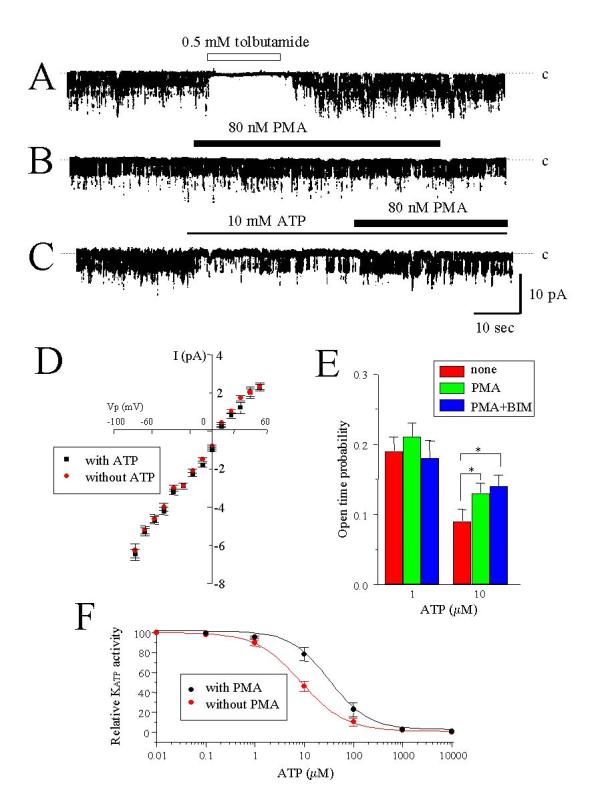
Figure 6.

Effect of PMA on the ATP inhibition of KATP activity. (A) Single channel current recordings in the inside-out configuration. The transmembrane potential was -60 mV (inside negative). Tolbutamide was applied to the intracellular side of the membrane at 0.5 mM. Inhibition of the current by tolbutamide indicates that KATP channel currents were recorded. (B) 80 nM PMA was applied inside the membrane. (C) ATP was first applied inside the membrane at 10 μM and then 80 nM PMA was further applied. Note that KATP activity was reduced by ATP, and application of PMA restored activity even in the presence of ATP. Representative tracings at least from five experiments are shown. (D) I-V relationship of KATP in the absence of ATP without (red circles) and with (black circles) 80 nM PMA. Data are from eight (without PMA) and six (with PMA) patches. (E) The values of open-time probability with and without 10 μM ATP inside the membrane are shown. Data with 80 nM PMA or with PMA plus 1 μM BIM are also shown. Each value is the mean of at least five experiments. *P < 0.05, compared with data with 10 μM ATP in the absence of PMA. (F) Concentration-dependence for ATP inhibition of KATP activity with and without 80 nM PMA. A series of experiments with ATP at various concentrations was carried out on the same patch. Data from twelve (without PMA) and six (with 80 nM PMA) patches. Theoretical curves for data with (a black line) or without (a red line) PMA were fitted to the Hill equation.
