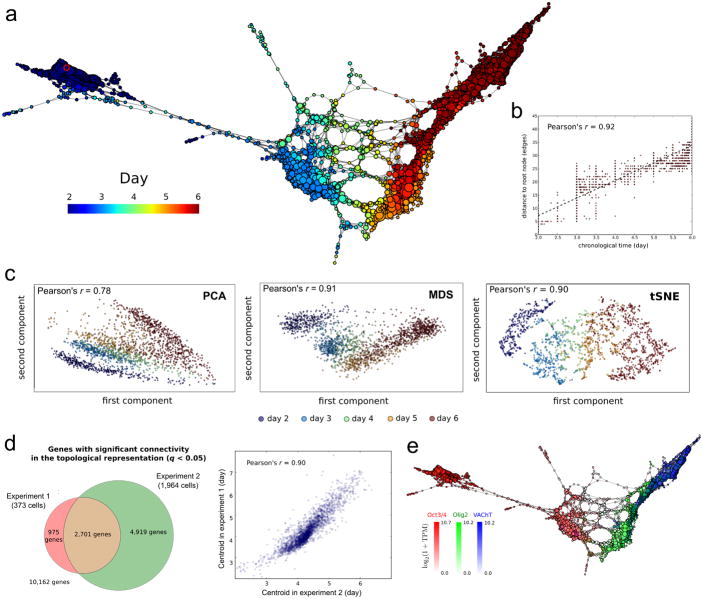
Figure 3. Differentiation of pluripotent mESCs into motor neurons (MN).
a scTDA recapitulates chronological order based on expression data alone. The topological representation of the expression data of 1,964 single cells, sampled from the differentiation of mESCs into MNs, is labeled by sampling time. The root node, inferred from the experimental chronological information, is indicated with a red circle.
b. The distance of each node to the root node, represented as a function of sampling time. The chronological time of a node is defined as the mean of the sampling times of the cells in the node.
c. Comparison with standard dimensional reduction algorithms. Dimensional reduction of the same expression data of 1,964 single cells, sampled from the differentiation of mESCs into MNs, using PCA, MDS, and t-SNE. The Pearson's correlation coefficient between the sampling time and the two-dimensional Euclidean distance to the root cell (defined as the one that maximizes this correlation) is indicated in each case.
d. Consistency between experiments 1 and 2. Left: Venn diagram of genes with significant gene connectivity (q < 0.05) in the topological representations of the two datasets. Both experiments are highly consistent in their calls (Fisher exact test p-value < 10-100). The number of significant genes is larger in experiment 2, consistent with its higher statistical power (due to the larger number of cells considered). Right: correlation between the centroid (expressed in pseudo-time) of the n = 2,701 genes with significant (q <0.05) gene connectivity in both topological representations. The distribution of gene centroids is highly consistent across the two experiments.
e. Known markers of pluripotent cells, motor neuron progenitors and post-mitotic neurons are successfully ordered. The topological representation is labeled by mRNA levels of Oct3/4 (red), Olig2 (green) and VAChT (blue).

