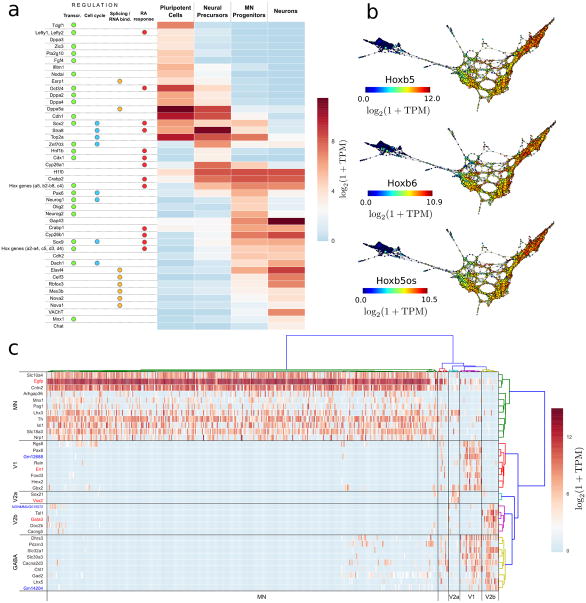
Figure 5. Differential gene expression in neurogenesis.
a Differentially expressed regulators and downstream genes in the four cell populations are shown. Genes are annotated according to their role in transcriptional, cell cycle, RNA binding protein regulation and RA response.
b. Topological representations (labeled by mRNA levels) of Hoxb5, Hoxb6 and the antisense lncRNA Hoxb5os, showing concordant expression of these transcripts during the generation of motor neurons from mESCs.
c. Post-mitotic neuronal populations. Differentially expressed genes between Vsx2+, Gata3+ and En1+ cells that were marked as post-mitotic neurons by the scTDA analysis. Hierarchical clustering of cells leads to five groups, four of which correspond to MNs, and V1, V2a and V2b interneurons. Hierarchical clustering of genes produces four groups of genes, uniquely expressed by each of the above cell types, and a fifth group associated to GABAergic neurons. lncRNAs are marked in blue.

