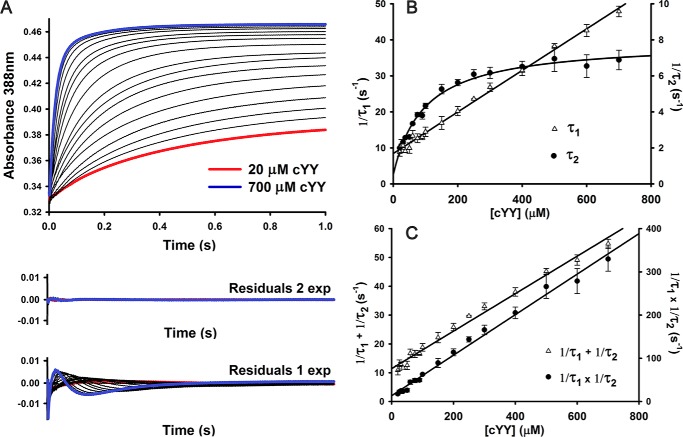
Figure 3.
Kinetic characterization of substrate cYY binding to CYP121. A, single-wavelength stopped-flow data collected at 388 nm monitoring formation of enzyme–substrate complex. Reaction conditions were pH 7.5, 21 °C, 5.05 μm heme after mixing. Residuals from fitting stopped-flow data with single- and double-exponential curves are shown. B, plot of reciprocal relaxation times from double-exponential fitting of single-wavelength stopped-flow data collected at pH 7.5 (5 μm heme after mixing). The slower phase shows saturation behavior at high cYY concentrations. Experiments were limited by low solubility of cYY in water. Error bars originate from fitting S.D. values from fitting multiple experimental data sets. C, replots of cYY concentration dependence data showing the sum and product of two observed reciprocal relaxation times from double-exponential fitting of data.

