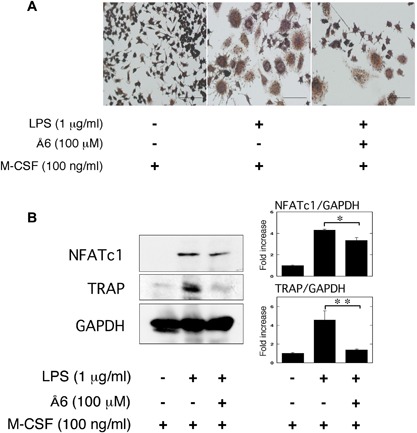
Figure 2.

Å6 attenuated OC differentiation of macrophage RAW264.7 cells promoted by LPS. RAW264.7 cells were cultured for 3 days in the absence or presence of LPS (1 μg/ml), M‐CSF (100 ng/ml), or Å6 (100 μM) as indicated. (A) TRAP‐staining was performed to detect OC differentiation. Scale bar = 100 μm. (B) The expression of NFATc1 and TRAP in RAW264.7 cells was examined by a Western blot analysis. The histogram on the right panel shows quantitative representations of NFATc1 or TRAP obtained from densitometry analysis after normalization to the levels of GAPDH expression (n = 3). The data represent the mean ± SEM. *p < 0.01, **p < 0.05.
