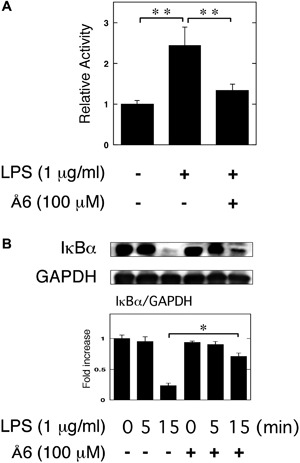
Figure 4.

Å6 attenuated NF‐κB activation induced by LPS in macrophage RAW264.7 cells. (A) RAW264.7 cells were co‐transfected with a Fluc reporter plasmind containing NF‐κB promoter and the internal control vector pRL‐TK. At 24 h after the transfections, these cells were cultured in the presence or absence of 100 μM Å6 for 30 min, and then stimulated with 1 μg/ml LPS for 3 h. Finally, the transcriptional activity of NF‐κB was performed (n = 3). (B) RAW264.7 cells were pretreated with 100 μM Å6 for 30 min and then stimulated with 1 μg/ml LPS for the indicated periods. Degradation of IκBα was evaluated by a Western blot analysis using anti‐ IκBα antibody. The histogram on the bottom panel shows quantitative representations of IκBα obtained from densitometry analysis after normalization to the levels of GAPDH expression (n = 3). The data represent the mean ± SEM. *p < 0.01, **p < 0.05.
