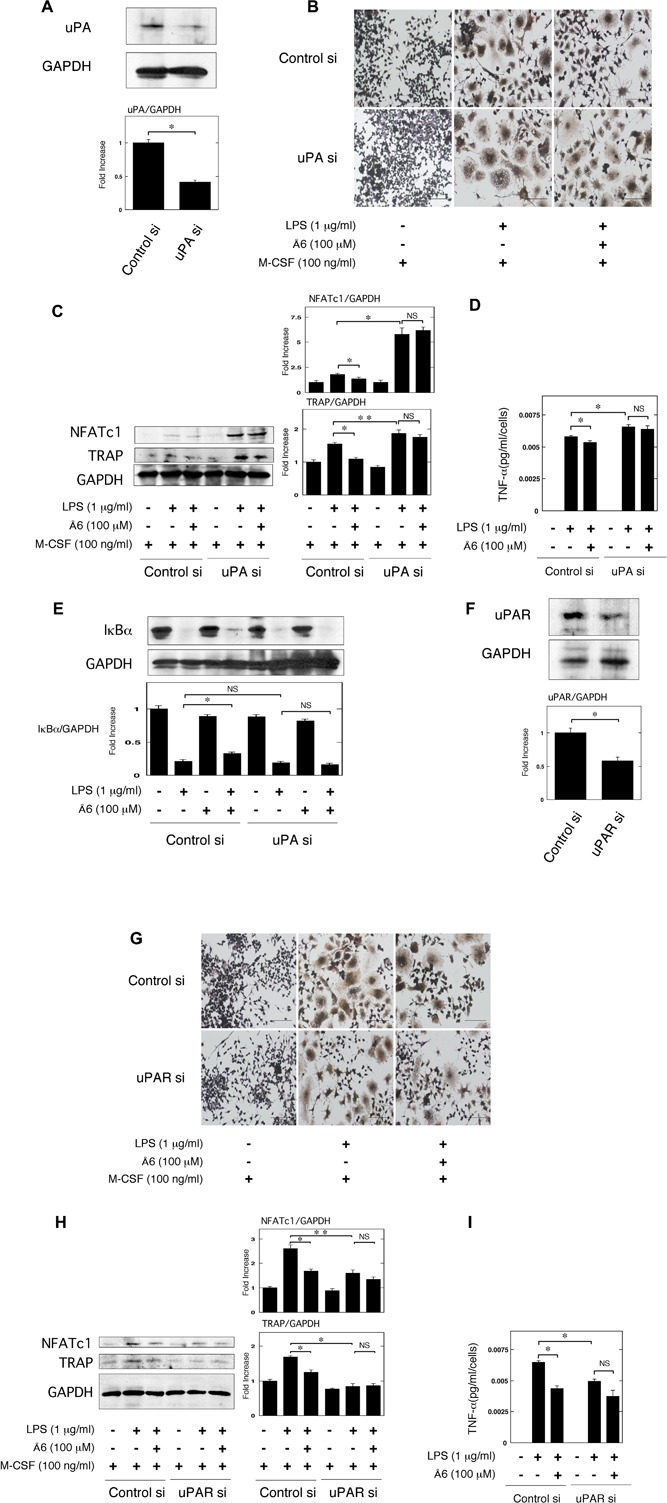
Figure 6.

No effects of Å6 on the LPS‐induced inflammatory OC differentiation in the uPA or uPAR knockdown conditions. (A) Status of uPA expression in RAW264.7 cells transfected with control or uPA siRNA was examined by a Western blot analysis. The histogram on the bottom panel shows quantitative representations of uPA obtained from densitometry analysis after normalization to the levels of GAPDH expression (n = 3). (B and C) Firstly, either control or uPA siRNA RAW264.7 cells were cultured for 3 days in the absence or presence of LPS (1 μg/ml), M‐CSF (100 ng/ml), or Å6 (100 μM) as indicated. (B) TRAP‐staining was performed to detect OC differentiation. Scale bar = 100 μM. (C) The expression of TRAP and NFATc1 in RAW264.7 cells with control or uPA siRNA was examined by a Western blot analysis. The histogram on the right panel shows quantitative representations of NFATc1 or TRAP obtained from densitometry analysis after normalization to the levels of GAPDH expression (n = 3). (D) RAW264.7 cells were cultured with either control or uPA siRNA for 24 h in the absence or presence of LPS (1 μg/ml) or Å6 (100 μM) as indicated. The TNF‐α content in the conditioned media of RAW264.7 cells transfected with control or uPA siRNA was determined by using ELISA as described in Materials and Methods (n = 3). (E) RAW264.7 cells were pretreated with Å6 (100 μM) for 30 min and then stimulated with LPS (1 μg/ml) for 15 min. Degradation of IκBα was evaluated by a Western blot analysis. The histogram on the bottom panel shows quantitative representations of IκBα obtained from densitometry analysis after normalization to the levels of GAPDH expression (n = 3). (F) Status of uPAR expression in RAW264.7 cells transfected with control or uPAR siRNA was examined by a Western blot analysis. The histogram on the bottom panel shows quantitative representations of uPAR obtained from densitometry analysis after normalization to the levels of GAPDH expression (n = 3). (H and I) Firstly, either control or uPAR siRNA RAW264.7 cells were cultured for 3 days in the absence or presence of LPS (1 μg/ml), M‐CSF (100 ng/ml), or Å6 (100 μM) as indicated. (G) TRAP‐staining was performed to detect OC differentiation. Scale bar = 100 μM. (H) The expression of TRAP and NFATc1 in RAW264.7 cells with control or uPAR siRNA was examined by a Western blot analysis. The histogram on the right panel shows quantitative representations of NFATc1 or TRAP obtained from densitometry analysis after normalization to the levels of GAPDH expression (n = 3). (I) RAW264.7 cells were cultured with either control or uPAR siRNA for 24 h in the absence or presence of LPS (1 μg/ml) or Å6 (100 μM) as indicated. The TNF‐α content in the conditioned media of RAW264.7 cells transfected with control or uPAR siRNA was determined by using ELISA as described in Materials and Methods (n = 3). *p < 0.01, **p < 0.05, NS, not significant.
