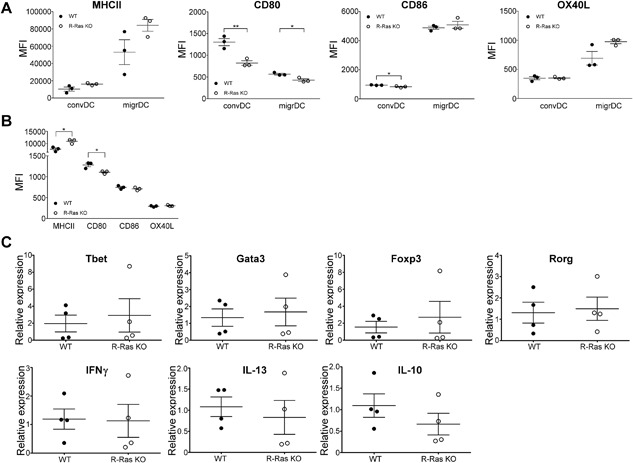
Figure 2.

Comparison of the expression of dendritic cell surface proteins and expression of T‐helper cell transcription factors and cytokines between WT and R‐Ras KO mice. LNs (A) and spleens (B) were collected from untreated wild type (WT, n = 3) or R‐Ras deficient (R‐Ras KO, n = 3) mice and DC's were enriched as in Figure 1. (A) The expression of MHCII, CD80, OX40L, and CD86 surface proteins in conventional (convDC) and migratory dendritic cells (migrDC) from the LNs and (B) from the spleen. (C) Spleens of un‐manipulated WT and R‐Ras KO mice (n = 4 for each genotype) were harvested. mRNA was isolated from total splenocytes and transcribed into cDNA. The expression of Th‐specific transcription factors and cytokines were investigated with qPCR. The differences within surface protein expression (A and B) or gene expression (C) values were statistically analyzed by two‐tailed unpaired t‐tests. *p < 0.05, **p < 0.01. Each dot represents an individual animal. Mean values with SEM are marked in the scatter dot plots.
