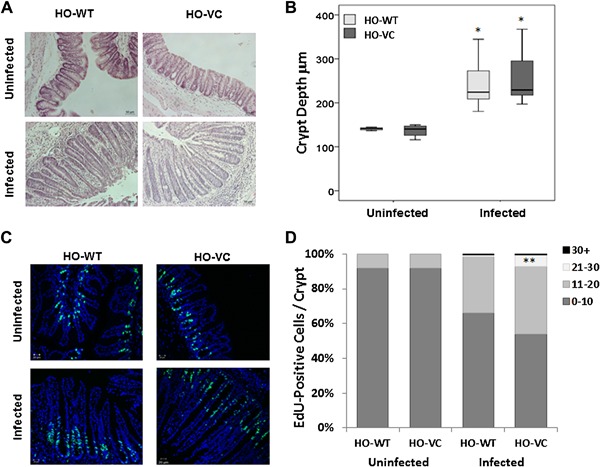
Figure 2.

Epithelial cell turnover in knockout (HO‐VC) versus control (HO‐WT) mice. (A) Representive H&E stained sections of HO‐VC and HO‐WT cecum from uninfected and infected mice. (B) Box and Whisker plot showing average crypt depth (μm) of cecal tissue in uninfected and at 35 days post infection. Key: Light grey, HO‐WT; dark grey, HO‐VC. *p < 0.0001. (C) Representive EdU stained tissue showing proliferative cells (green) and counterstain (blue) of HO‐VC and HO‐WT cecum from uninfected and infected mice. (D) Percentage EdU positive cells in different regions of cecal crypts. Key indicates cell distance from bottom of crypt. **p = 0.008 Student's t‐test. Uninfected n = 3 HO‐WT and n = 5 HO‐VC. Infected n = 12 in both genotypes. Data acquired across two independent experiments.
