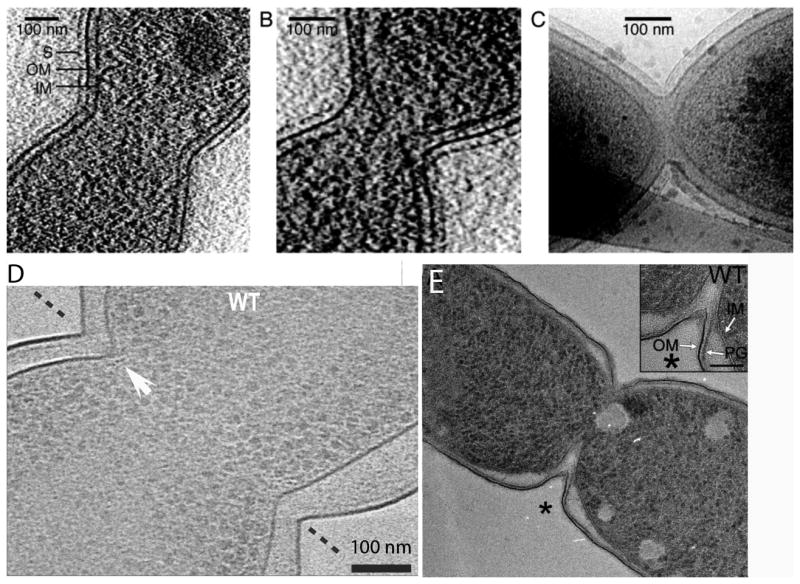
Figure 4.

A-C: Division in C. crescentus imaged by cryoEM tomography (reprinted from [37]). The shallow V shape was interpreted to indicate a constrictive mode of division. A and B are slices through a 3D tomogram, while (C) is a projection through the whole bacterium. D: Division of E. coli imaged by cryoEM tomography, showing a slice through the 3D tomogram (reprinted from [39]. The white arrow points to small dots identified as FtsZ filaments in cross-section. This cell has a sharp, V-shaped constriction, typical of constrictive division. The periplasm of this cell is considerably expanded, especially at lower right. E: A dividing E. coli cell prepared by high pressure freezing, freeze substitution (reprinted from [40]. The division shows a V-shaped constriction and a clearly extended invagination of the IM, forming a septum.
