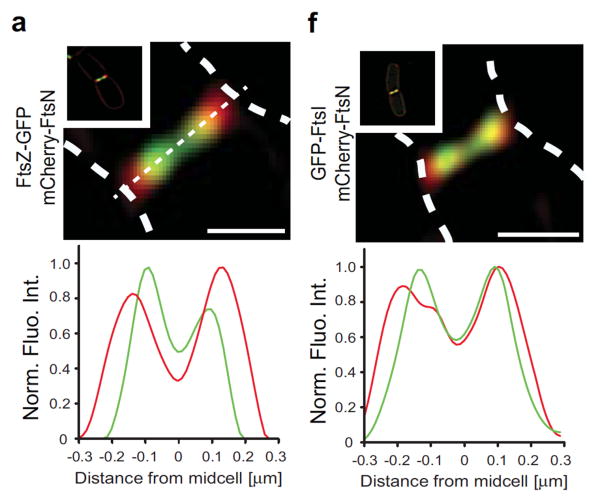
Figure 6.
Localization of FtsZ, FtsN and FtsI by SIM superresolution microscopy. Dashed white lines indicate the cell boundaries. Panel a shows that FtsZ (green) is significantly toward the center of the cell relative to FtsN (red). Panel f shows that FtsI is almost co-localized with FtsN, but slightly toward the center. Reprinted from [42].

