Figure 1.

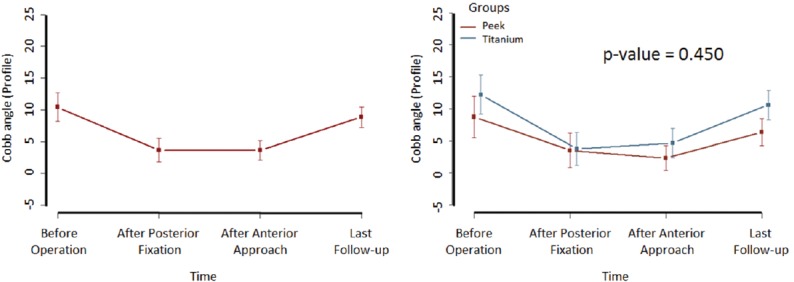
Variation of sagittal alignment among the four evaluated stages and between groups. P value was calculated using the marginal log-linear model based on Chi-square analysis

Variation of sagittal alignment among the four evaluated stages and between groups. P value was calculated using the marginal log-linear model based on Chi-square analysis