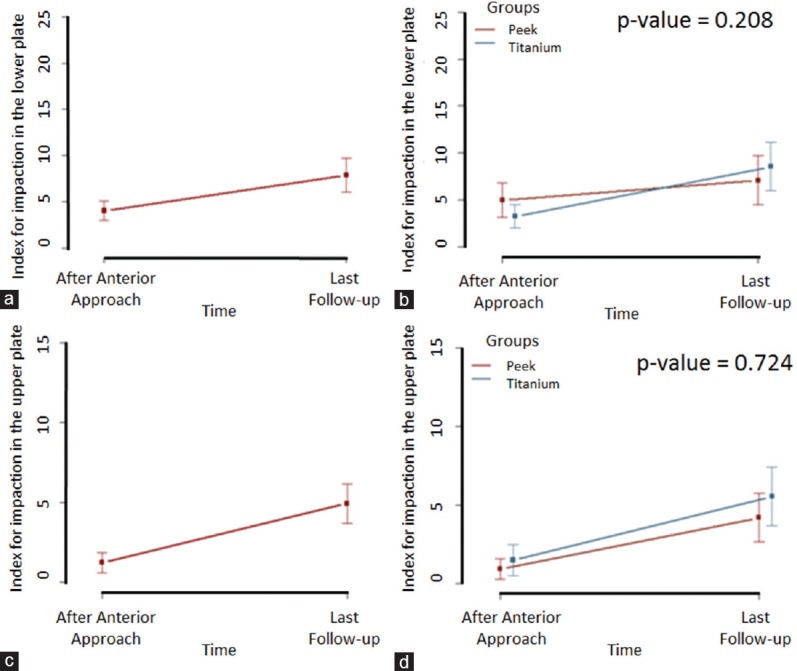
Figure 2.

(a) Mean percentage value of impaction on the lower plateau in the cage placement immediate postoperative stage (Stage 3) and at final follow-up. (b) Change in impaction on the lower plateau in the cage placement immediate postoperative stage (third evaluation) and at the final follow-up for the two groups. (c) Mean percentage value of impaction on the upper plateau in the cage placement immediate postoperative stage (Stage 3) and at the final follow-up. (d) Change in impaction in the upper plateau in the cage placement immediate postoperative stage (third evaluation) and at the final follow-up for the two groups. P value was calculated using the marginal log-linear model based on Chi-square analysis
