Figure 1.

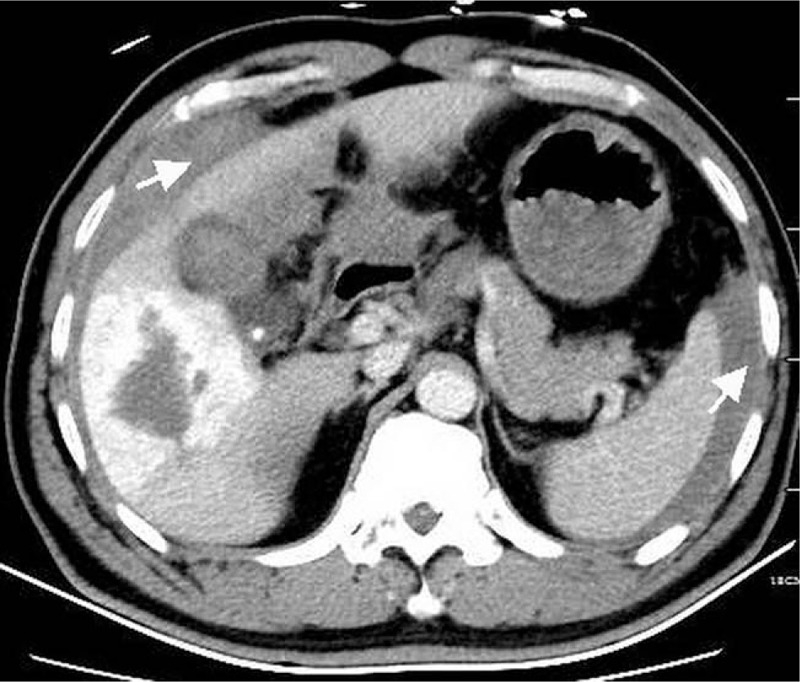
CT with intravenous contrast demonstrates a hepatic hemangioma and free high attenuation fluid around the liver and spleen (arrow). CT = computed tomography.

CT with intravenous contrast demonstrates a hepatic hemangioma and free high attenuation fluid around the liver and spleen (arrow). CT = computed tomography.