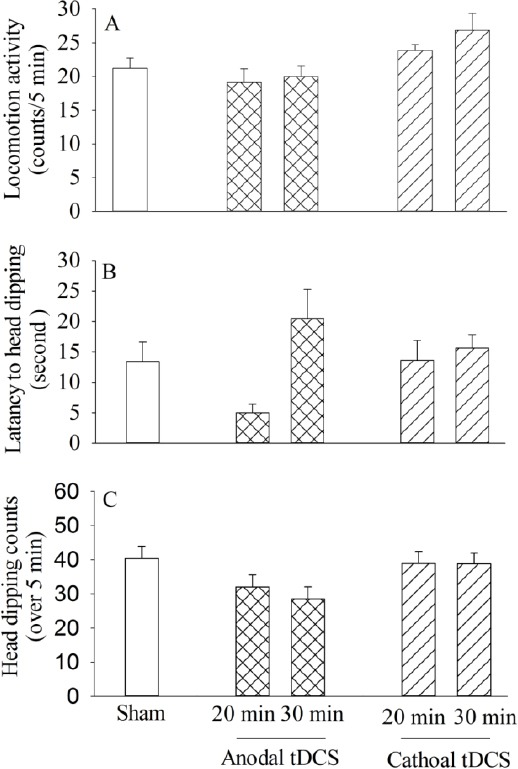
Figure 4.

Comparison of exploratory behaviors: the locomotor activity during 5 min (A), head-dip latency (B), head dipping counts for 5 min (C), the exploratory behaviors of subjects were assessed by a hole-board apparatus. All bars are expressed as mean±SEM (sham group: n = 9, anodal or cathodal group: n=8; *P < 0.05, **P<0.01 compared with the sham group)
