
Fig. 1.
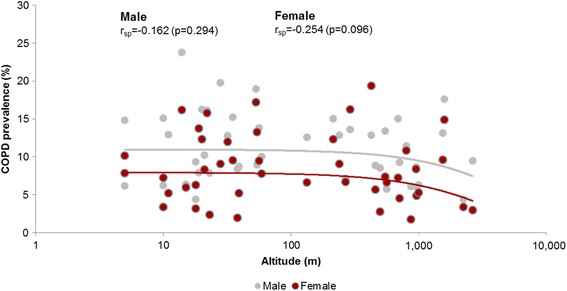
Scatterplot of the association of COPD prevalence by site (%) with altitude (m), with regression line explored by sex
Official websites use .gov
A
.gov website belongs to an official
government organization in the United States.
Secure .gov websites use HTTPS
A lock (
) or https:// means you've safely
connected to the .gov website. Share sensitive
information only on official, secure websites.
Scatterplot of the association of COPD prevalence by site (%) with altitude (m), with regression line explored by sex