
Fig. 2.
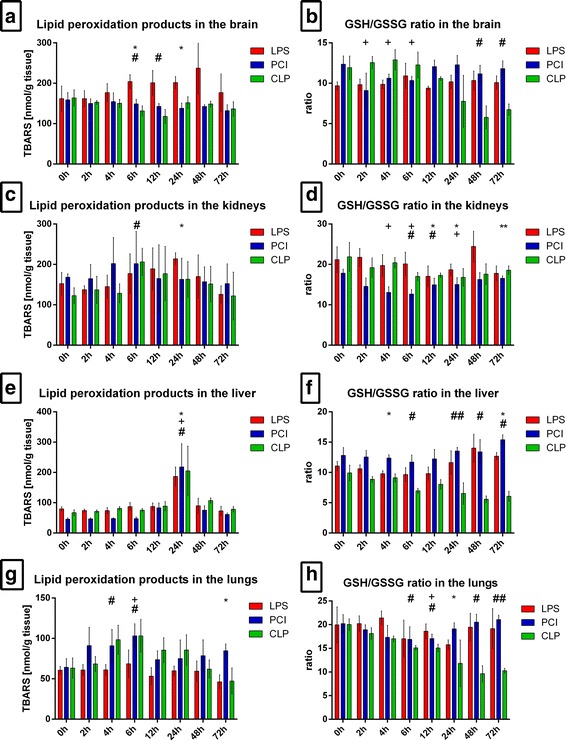
Oxidative stress in different organs. At the time point indicated, mice were sacrificed and different organs were collected for the analysis of the tissue content of lipid peroxidation products as determined by thiobarbituric acid reactive substances (TBARS) (a, c, e, g). Additionally, the glutathione status was assessed and the GSH/GSSG ratio was calculated (b, d, f, h). Data are given as mean ± standard deviation (SD), n = 4–6 for each group and time point. Statistical significance was determined by using the non-parametric Kruskal-Wallis test, followed by pairwise Mann-Whitney U tests. Statistical comparisons were made versus the control of each group and are denoted as follows: LPS (asterisk, *), PCI (plus, +), CLP (diamond, #). A p value <0.05 (*,+,#) was considered statistically significant; a p value <0.01 (**,++,##) and a p value <0.001 (***,+++,###) are further specified