
Fig. 7.
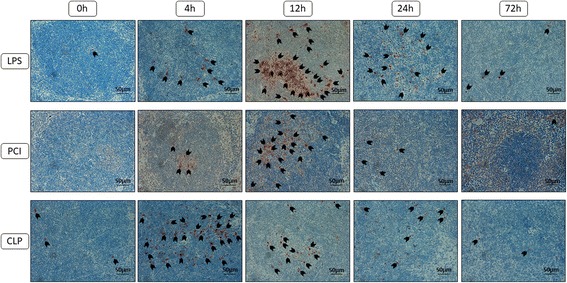
Cleaved caspase-3 expression in the spleens. At the time point indicated, mice were sacrificed and the spleens were collected for immunohistological analysis. Representative photomicrographs from one of 4–6 different tissue samples stained for cleaved caspase-3 expression are shown (red-brown color, counterstaining with hematoxylin; original magnification: 400×). 0 h, 4 h, 12 h, 24 h and 72 h were chosen as representative time points to depict the course. Furthermore, arrowheads were added to obtain an overview about the amount of cells expressing the enzyme